Overview
As explained in Governify documentation, Governify is a service agreement management framework that boosts the service governance by supporting audits in an automated way. Among its use cases, Governify can be used to audit external infrastructures, which is the purpose for which Falcon Infrastructure was created.
Falcon Infrastructure is a Governify-based infrastructure that allows to audit other infrastructures teams in a simple way. It is composed of a subset of Governify microservices that can be deployed either in a single machine or in a cluster. Thanks to the integration of Prometheus for scraping different metrics from external infrastructures Falcon can connect to them and collect Prometheus metrics that can be used to audit those systems based on Service Level Agreements (SLA).
Quick Tour
The main interface is accesible from ui.falcon.[YourDomain]. The default credentials for this interface are:
- User: governify-admin
- Password: governify-project
This credentials can be changed in the .env file.
In this interface you should be able to see the infrastructures that are being monitored. At first, it will display a card showing a message .
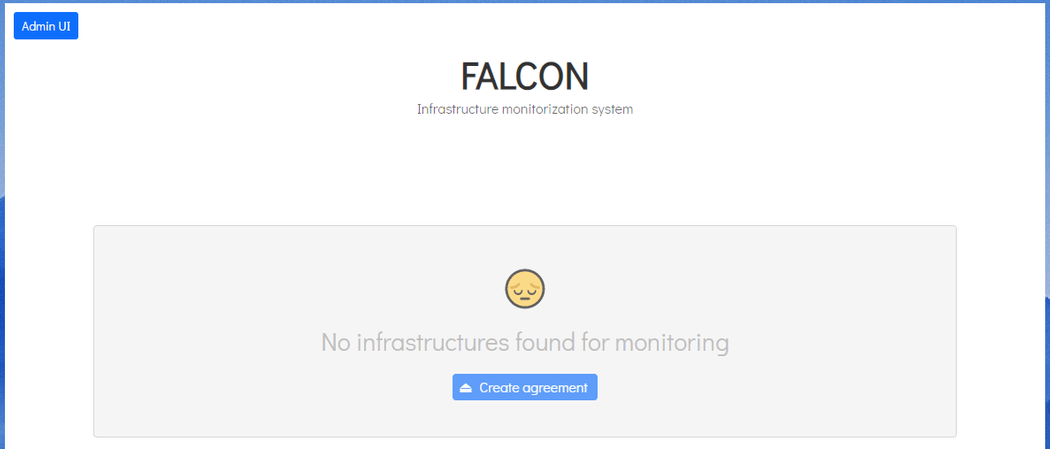
To start monitoring any infrastructure, check the adding infrastructures section. After setting up the configuration for one infrastructure, you should see a card displayed in the user interface at ui.falcon.[YourDomain].
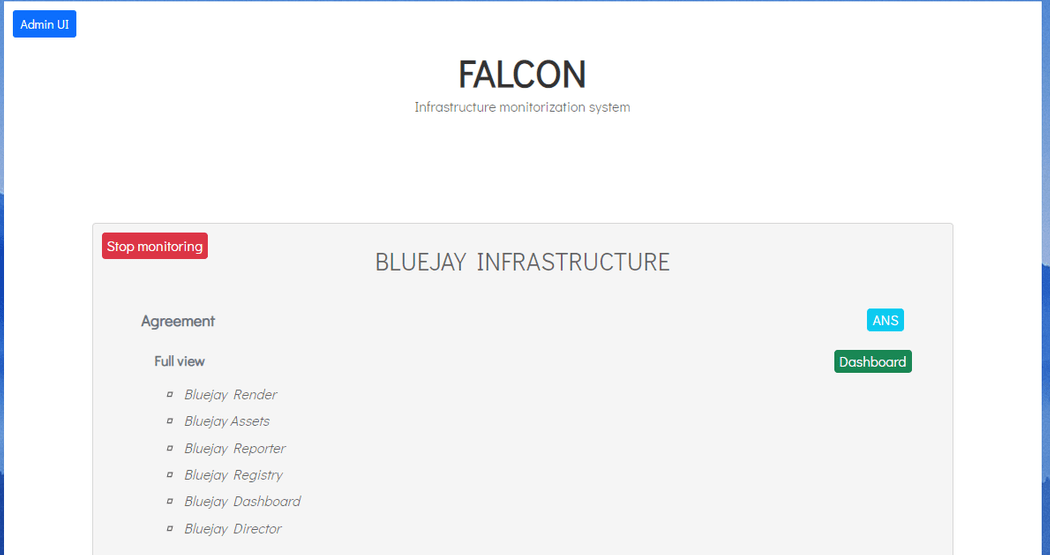
After clicking the ANS button, a new tab will open and the SLA view of the project should appear. It contains information about the infrastucture being monitored along the guarantees and metrics in use.
To calculate data for this infrastructure, the top-right blue button Calculate Metrics has to be clicked. A window will pop-up asking for confirmation, since the previous records will be deleted.
Note that Falcon is intended for monitoring and thus, the automatic computation is more suitable in this case. It is strongly recommended to leave automatic computation turned on in case you want to continously keep records of your infrastructure's metrics.
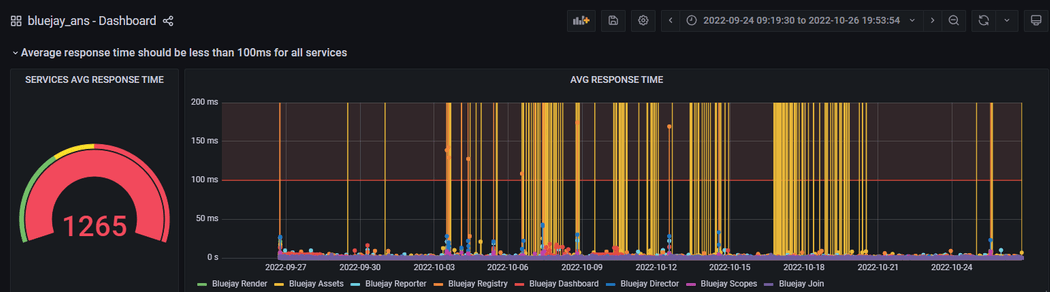
Clicking the Dashboard green button at the top-right corner, a new tab will open. The default username and password are governify-admin and governify-project.
This credentials can be changed, once logged, going to the icon in the bottom left part of the Dashboard, clicking on preferences, and accessing the section Change password at the top of the page.
Once logged, the dashboard for the project will be opened where all the audit data can be viewed.